

Reading Candlestick Charts: A Clearer Look at Position Holding and Market Signals
Candlestick charts have long been favored by traders for their ability to visualize price action, especially when evaluating position holding strategies. In recent weeks, discussions around their effectiveness have resurfaced—prompted by rising volatility and renewed interest from retail investors. This article examines what candlestick charts truly offer, and where caution is still warranted.

What One Candlestick Really Shows
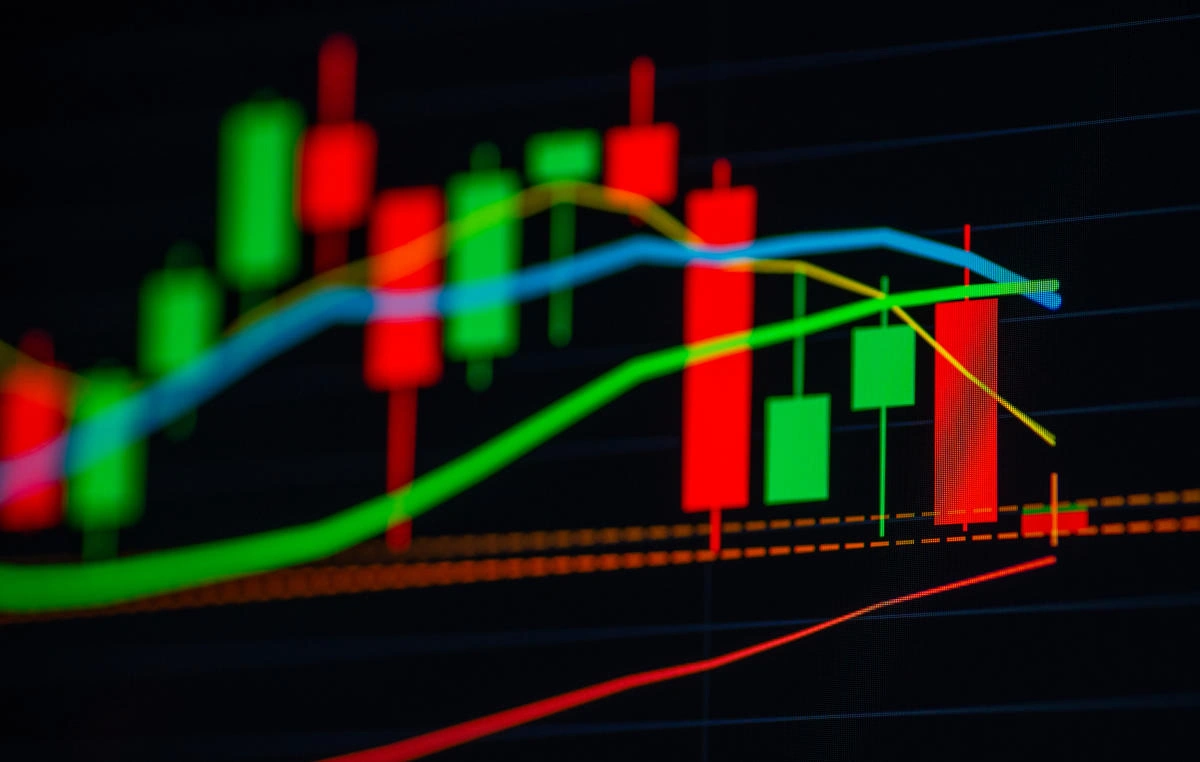
Each candlestick represents a compact story of price movement. It visualizes the open, close, high, and low prices within a given timeframe—whether that’s five minutes or five days. When the closing price is higher than the opening, the candlestick appears green or white; when lower, it appears red or black. Simple in appearance, these visuals can reveal momentum or hesitation in the market.
Context Matters More Than Color
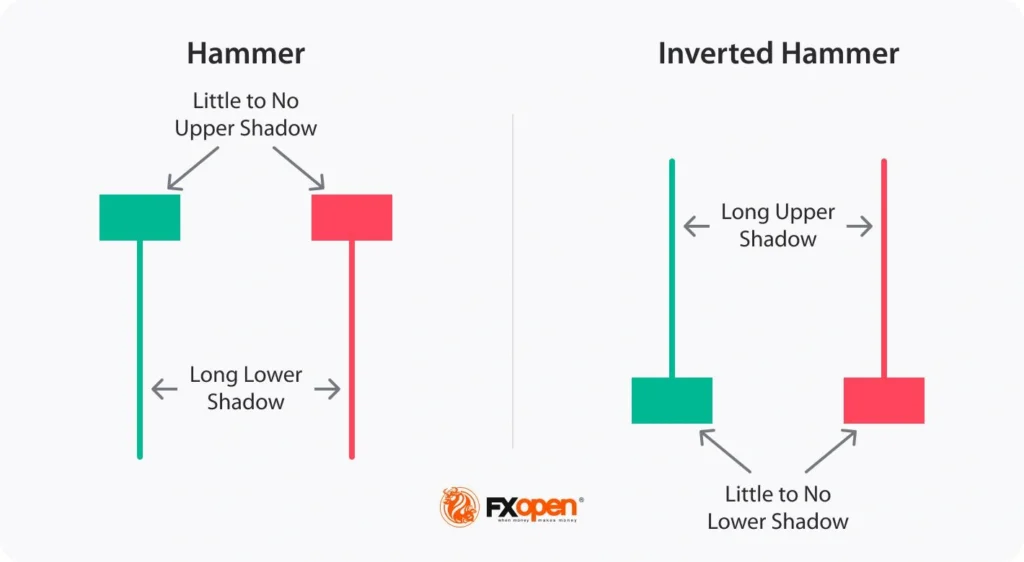
Interpreting a single candlestick without its context is misleading. Analysts warn against relying on isolated patterns—such as the “hammer” or “doji”—without considering the broader trend. For instance, a hammer might suggest a reversal, but only if it follows a pronounced downtrend. Without such context, the pattern could be noise rather than signal.
Position Holding Shapes Interpretation
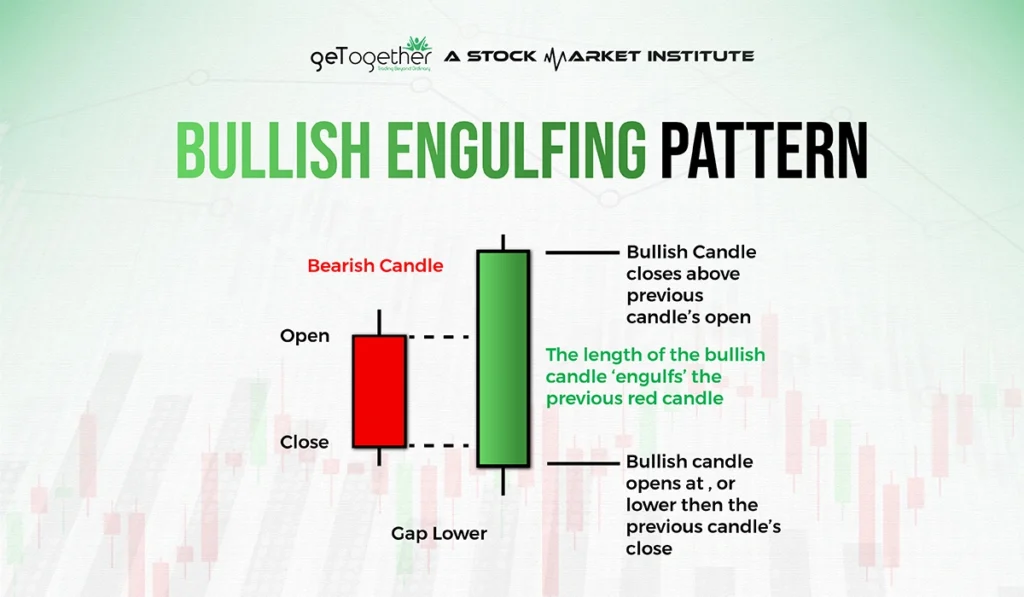
The role of position holding is key in how candlestick patterns are used. When traders maintain long or short positions across multiple sessions, chart signals may take on new meanings. For example, a bullish engulfing pattern may signal confidence among long holders—yet it could also be a last push before reversal, depending on volume and market sentiment.
Reading Multiple Candlestick Charts for Trend Clarity
Most actionable insights come from observing candlestick clusters, not single shapes. A trend formed by a series of rising candlesticks with higher highs and higher lows may confirm a bullish direction. Conversely, a sudden break in that pattern—with large red candles—can suggest a shift in sentiment. The true value lies in recognizing these transitions early.
Candlestick Charts Are Not Promises
Experts caution against using candlestick charts as predictive tools. They are retrospective in nature—showing how prices moved, not why. While certain patterns might seem predictive due to repetition, factors like news events, economic data, and institutional trades often override historical tendencies. “Candles are clues, not commands,” one market analyst remarked last week.
Position Holding & Psychological Triggers
Candlestick charts also reflect trader psychology, especially among those holding positions overnight. A long upper wick, for example, might show early optimism followed by late selling—perhaps due to caution about pending earnings or macroeconomic updates. Traders with open positions are especially sensitive to these visual cues.
Final Take: A Tool, Not a Forecast
Candlestick charts remain a popular visual aid, but they are not a crystal ball. Their strength lies in highlighting market structure and price action—but interpreting them requires awareness of position holding, macro context, and broader sentiment. As retail participation grows, so too does the need for careful, informed analysis of what these charts are actually showing.
Relevant news: here