

From Confusion to Clarity: A Beginner’s Journey with TradingView Tools
The first time I opened a TradingView Tools chart, I stared at the screen for a full minute, unsure where to begin. Candlesticks flickered across the page. Toolbars hugged every corner. Numbers moved like ants on a sugar trail. For someone unfamiliar with charting platforms, it felt overwhelming.
But slowly, one click at a time, it started to make sense.
TradingView is designed for traders of all levels. Whether you’re curious about forex or exploring Vietnam’s stock market, the platform offers powerful tools that are surprisingly intuitive once you know where to look. This article isn’t a list of features. It’s a guided experience—one that mirrors the real path a beginner might take when first diving into the world of charts.
Starting with the Basics: Signing Up and Landing In
Credit from TradingView
Like most journeys, this one begins with a signup. TradingView’s free plan is generous, and for newcomers, there’s no pressure to upgrade right away. Once inside, the “Chart” tab becomes your main arena. Clicking it opens a full-screen view that, at first, feels more like a cockpit than a workspace.
Don’t let that intimidate you. The screen is modular. You can expand, collapse, or hide nearly every panel. A good first step? Clear away anything you don’t understand yet. Focus on the center chart and top menu bar. Let the rest fade into the background.
Choosing What to Watch: Forex, Stocks, and the VN Market
One of TradingView’s strengths is its global coverage. From major forex pairs like EUR/USD to local symbols like VIC.HOSE, everything is searchable. I began with something familiar—USD/VND—to get a feel for currency movement.
The symbol search is smart. You can type part of a name or code, and it offers quick suggestions. For Vietnamese users, this is particularly useful when tracking the VN-Index or specific HOSE/HNX stocks.
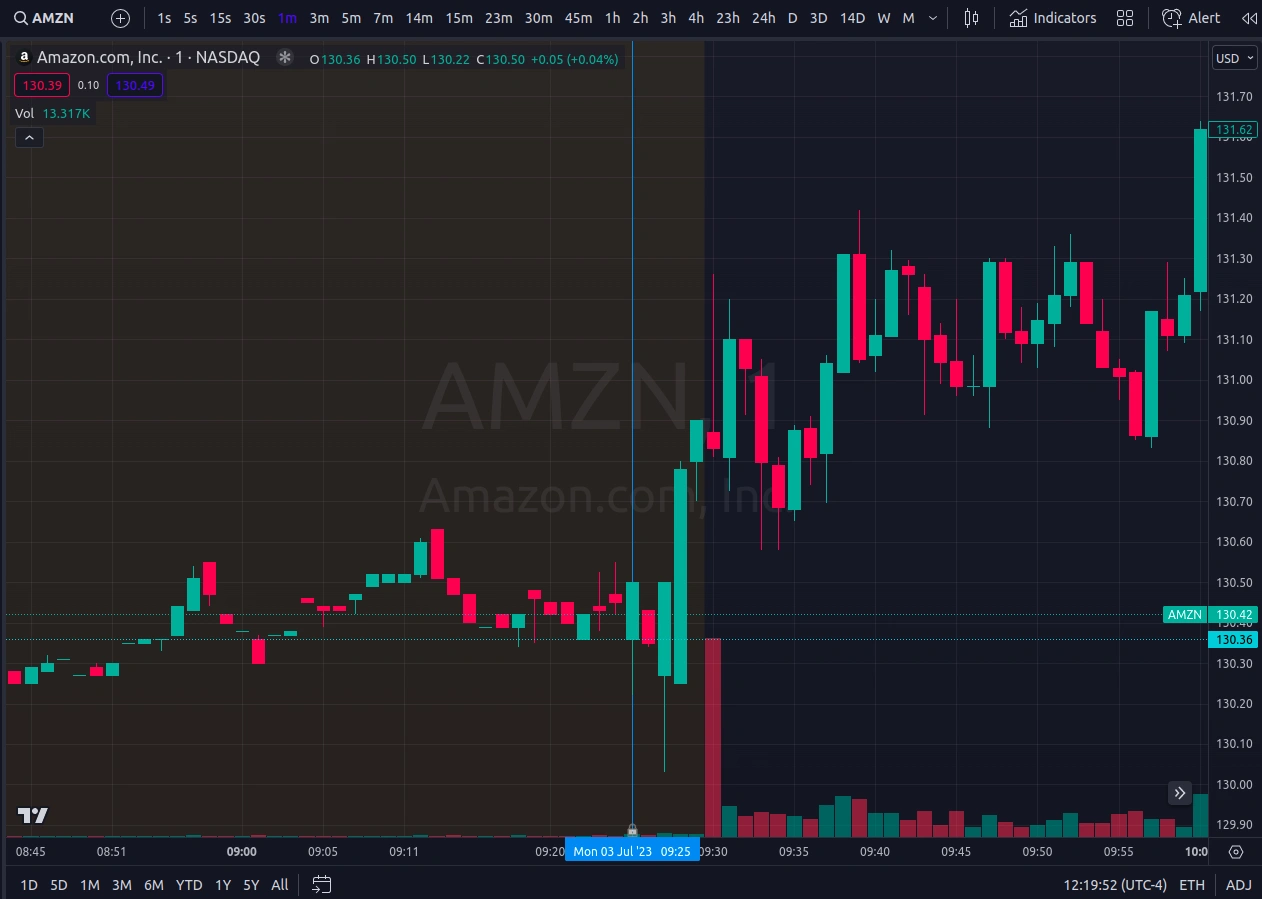
As the chart loads, it’s tempting to click everywhere. Don’t. Just watch the candles for a while. Hover over them. Read the open, high, low, and close data. Let the rhythm of price movement sink in.
Timeframes and Perspectives: Seeing the Market from Different Angles
Timeframes change everything. A five-minute chart might show chaos, while a daily chart tells a smooth story. I started with daily candles, observing how trends built over weeks rather than minutes. It gave me room to think.
Switching timeframes is easy—just one click on the toolbar. The same goes for chart types. I stuck with candlesticks at first. They offered more detail than line charts and helped me start noticing patterns. It’s like looking at waves and eventually realizing there’s a tide underneath.
Drawing Lines That Make Sense
Credit from TradingView
The first tool I fell in love with was the trendline. Drawing one from a recent low to a series of higher lows felt like discovering logic behind the chaos. Support and resistance, once abstract ideas, came alive on the screen.
TradingView makes drawing intuitive. Click, drag, release. Tools like horizontal lines, Fibonacci retracements, and rectangles help frame your thinking. It’s less about precision at this stage, and more about observation. When you start seeing price react at your lines, that’s when things get exciting.
TradingView Tools Indicators: Adding Layers to the Story
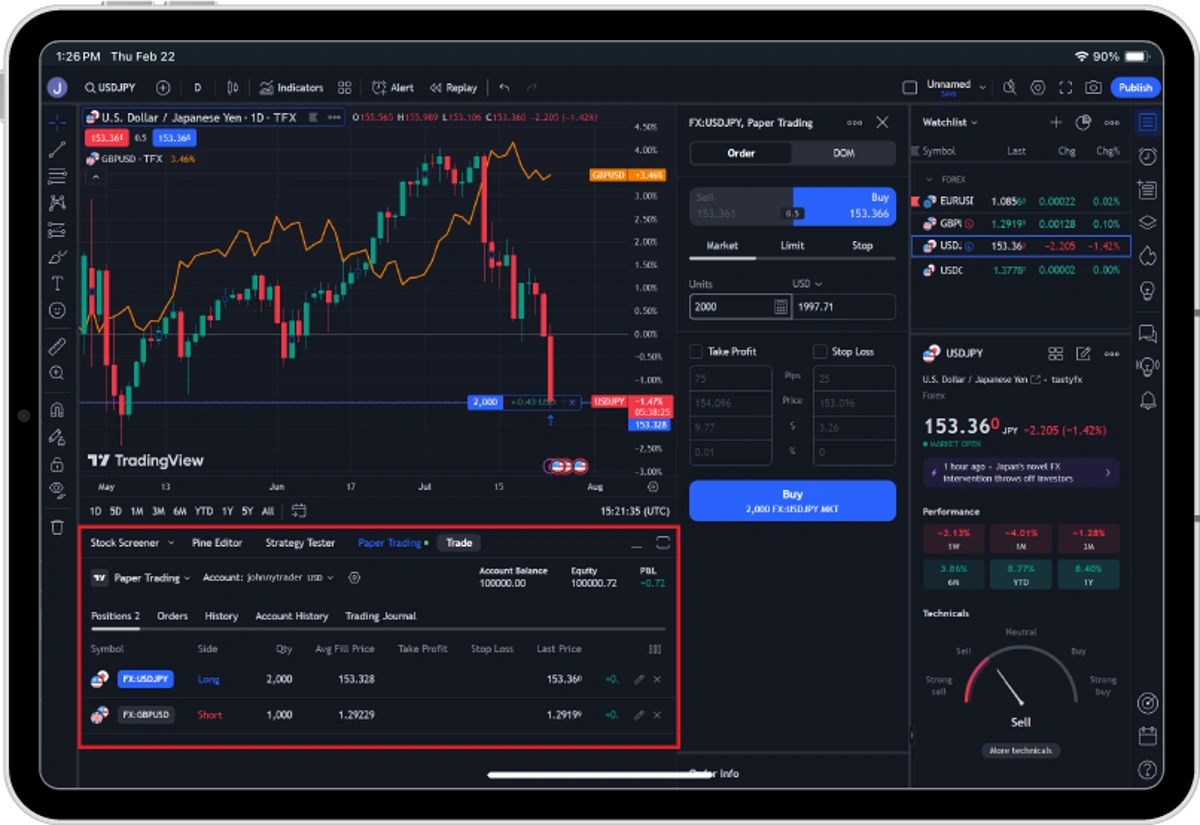
Credit from tastyfx
Indicators can easily become a rabbit hole, but used wisely, they’re incredibly insightful. I began with two: the RSI (Relative Strength Index) and a 50-period Moving Average. Together, they offered a sense of momentum and trend.
Adding them was as simple as clicking the “Indicators” button and typing in the name. Each one appeared directly on my chart, with customization options available via a gear icon. I changed colors to suit my eyes and adjusted lengths just to see how they affected the visuals.
For those analyzing VNINDEX or forex pairs like USD/VND, this kind of layering reveals the emotional undercurrent of the market. Overbought zones, momentum shifts, trend flattening—it all starts to make sense with time.
Saving, Naming, and Returning to Your Work
One mistake I made early was not saving my chart layouts. I’d draw lines, add indicators, and then refresh the page—only to find everything gone.
TradingView lets you save chart layouts under custom names. I now have one called “VN30 Rotation” and another called “Forex Evening View.” They preserve all my settings and tools, letting me pick up right where I left off.
Setting Alerts: Letting the Platform Work for You
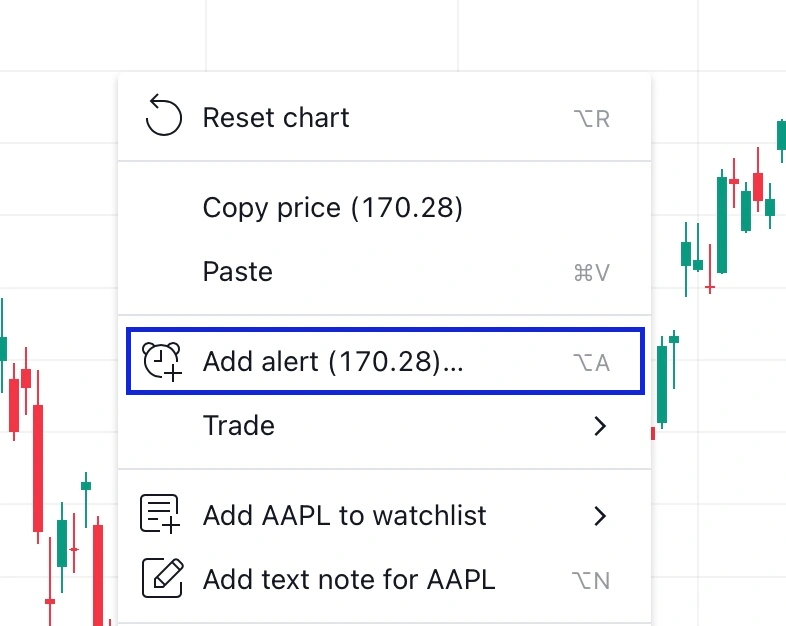
Credit from TradingView
You don’t need to babysit the chart all day. TradingView’s alert system acts like a digital assistant. Want to know when USD/VND crosses 24,000? Just set an alert and move on with your day.
Alerts can be triggered by price levels, indicators, or even complex conditions. Notifications arrive via email, pop-up, or phone app—whichever suits your routine.
Learning from Others: Vietnam’s TradingView Tools Community
One of the most underrated features is TradingView’s social layer. Thousands of users, including Vietnamese traders, post annotated charts daily. These shared “Ideas” offer context, strategy, and sometimes even humor.
I often browse the Ideas tab just to see how others mark up the same chart I’m studying. It’s a quiet form of mentorship. And once you’re comfortable, you can share your own charts too.
Practicing Without Risk: The Magic of Bar Replay
If you’re the kind of learner who needs repetition, TradingView’s “Bar Replay” mode is a gift. You pick a past date, hit play, and watch the market unfold one bar at a time. It’s like being dropped into a moment in history—but with the benefit of hindsight.
I used this to study how VNINDEX behaved during the 2022 downturn. Watching the decline in slow motion taught me more about fear, volume, and structure than any textbook could.
TradingView Tools: The Quiet Power of Persistence
There’s no secret shortcut to mastering TradingView tools. But what makes this platform unique is that it rewards patience. Day by day, your eyes adjust to the chaos. Candles become conversation. Indicators hint at emotion. Support zones whisper of memory.
This tutorial isn’t the end—it’s your entry ticket. Open a chart. Watch a symbol. Draw a line. Set an alert. Let the tools become familiar. Let the patterns speak.
And most importantly: keep showing up. The market is a patient teacher. TradingView is simply the classroom.